Monitoring Indicator Details
System Resource Metrics
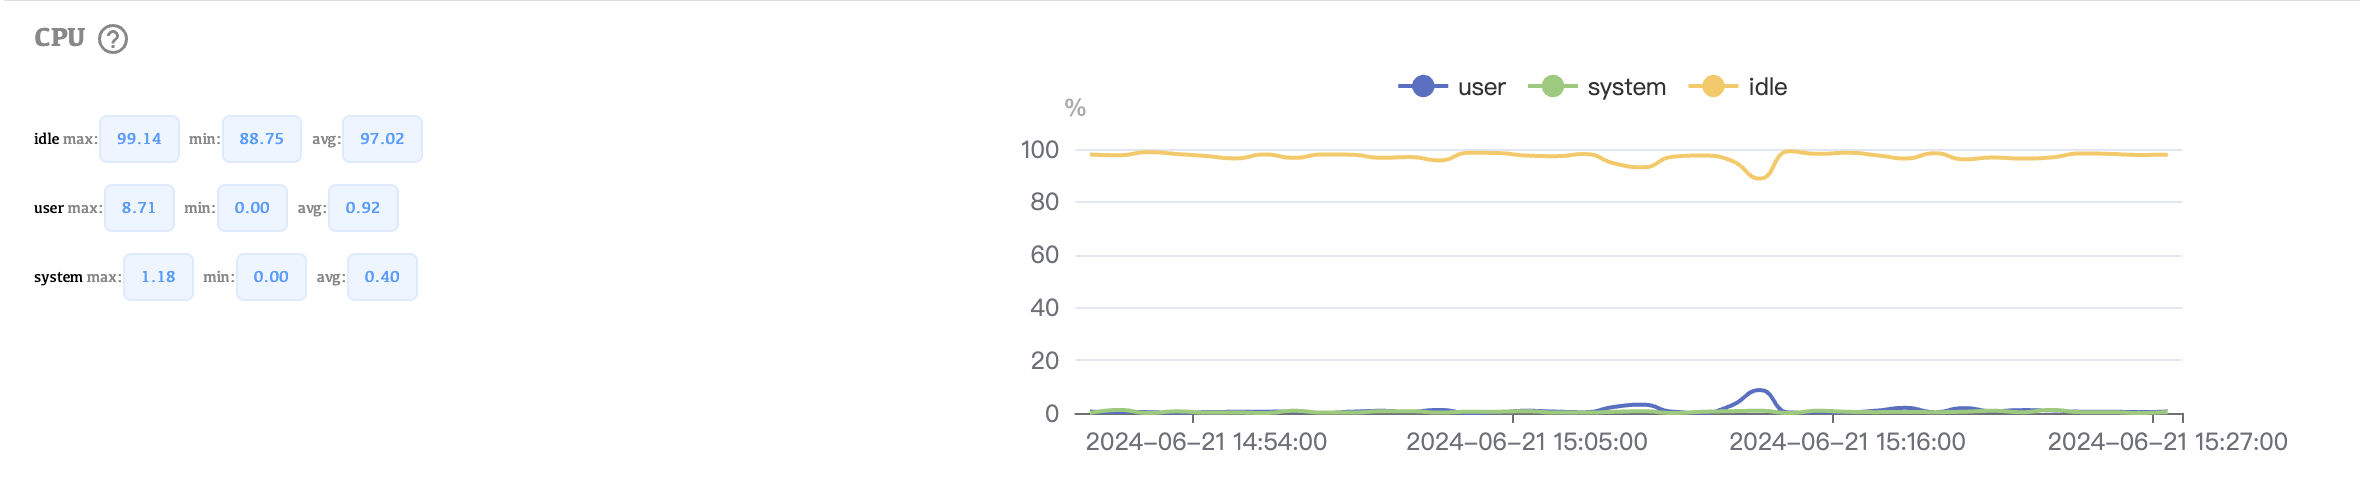
CPU: Monitors the CPU usage to identify if the system is overloaded.
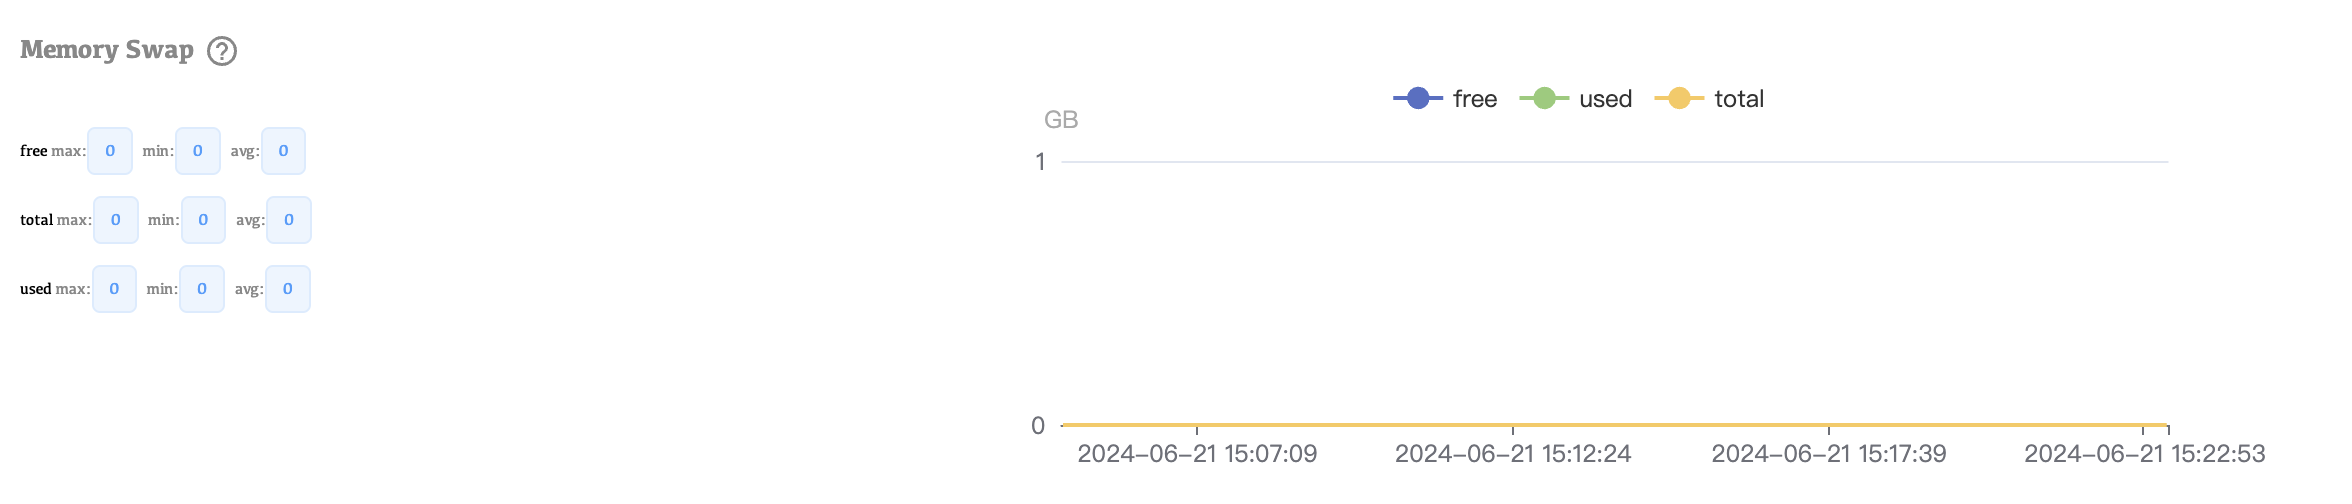
Memory Swap: Tracks swap space usage. Excessive swapping can degrade performance.
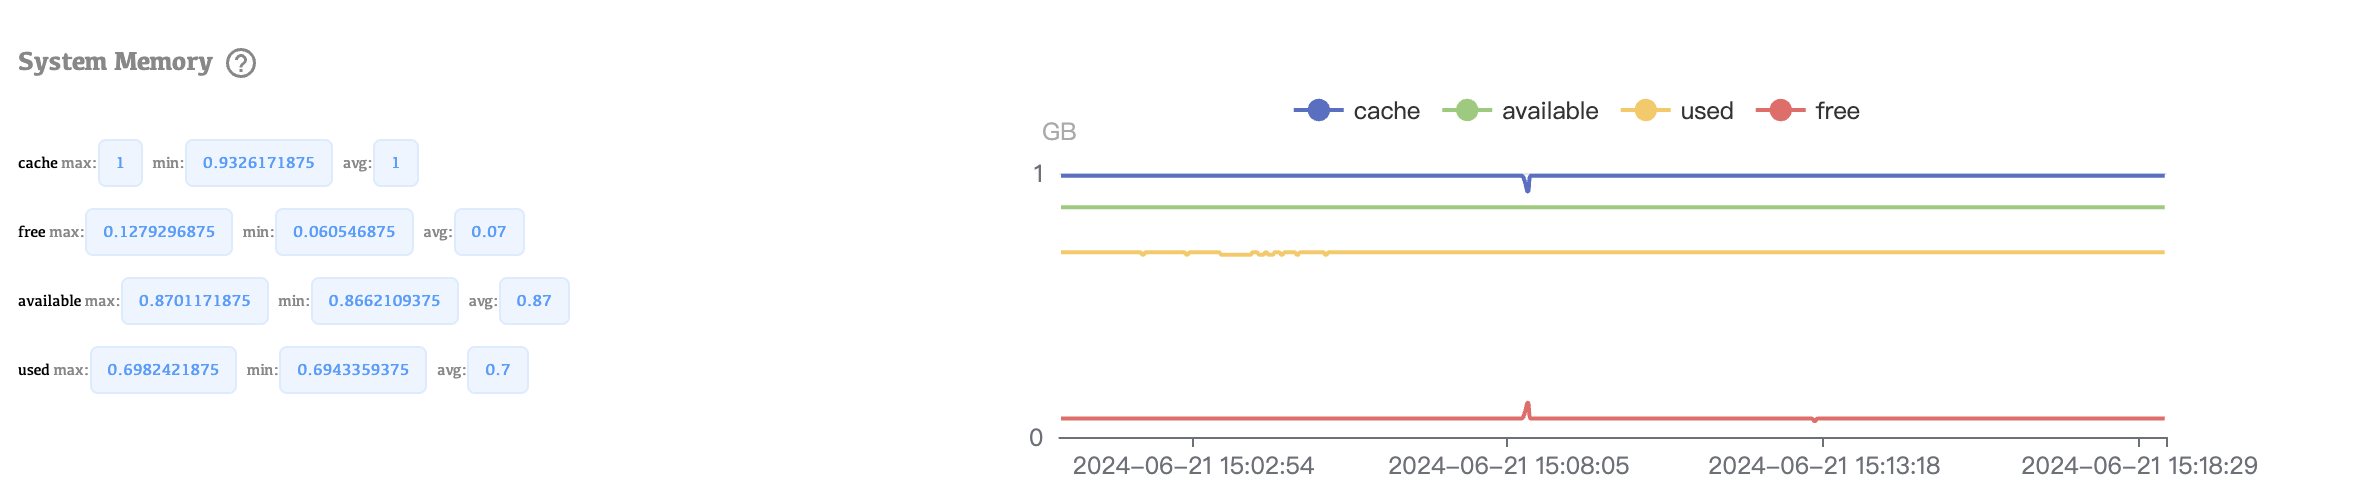
System Memory: Observes overall memory usage to ensure there’s enough available for MongoDB operations.
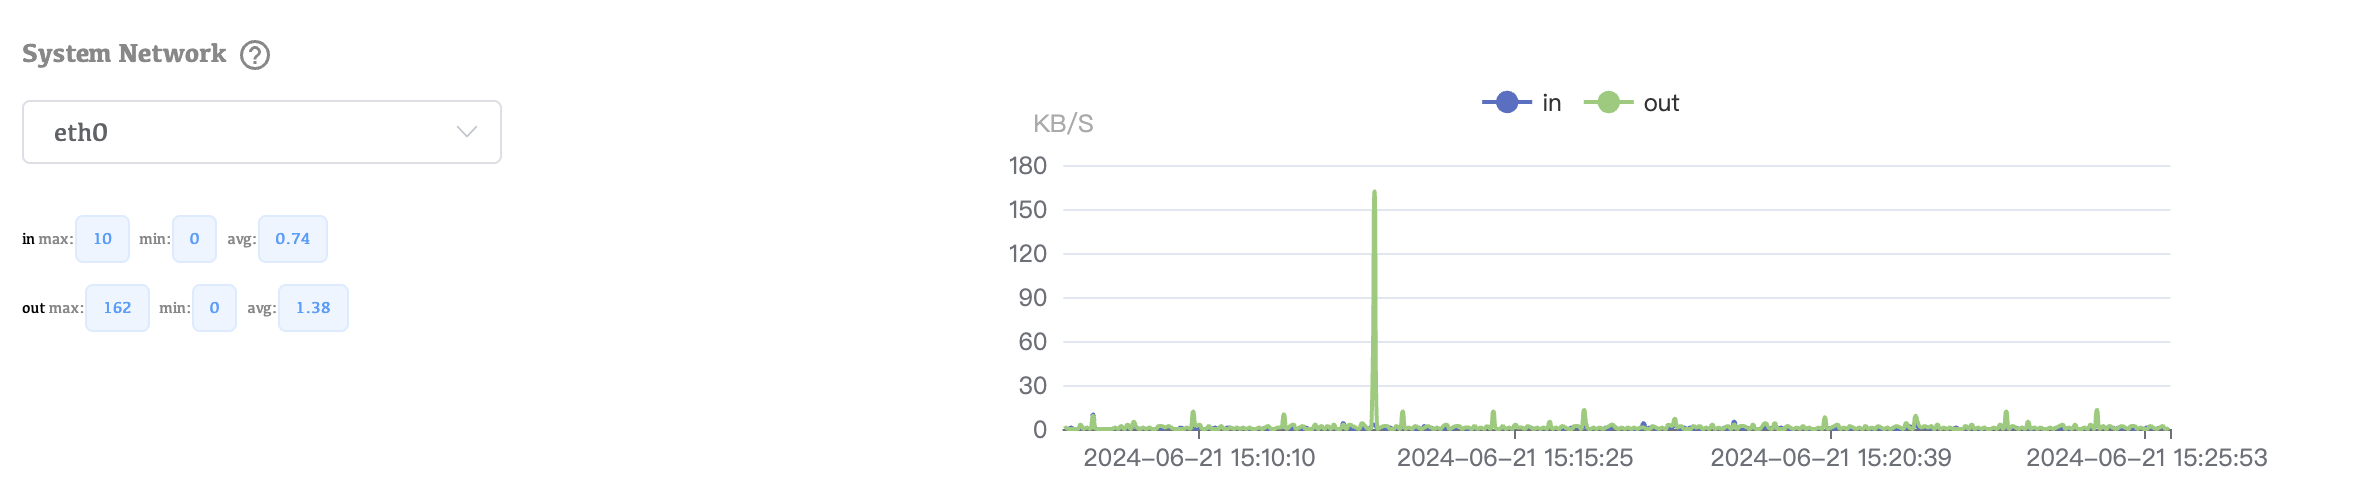
System Network: Monitors network throughput and latency to identify potential network bottlenecks.
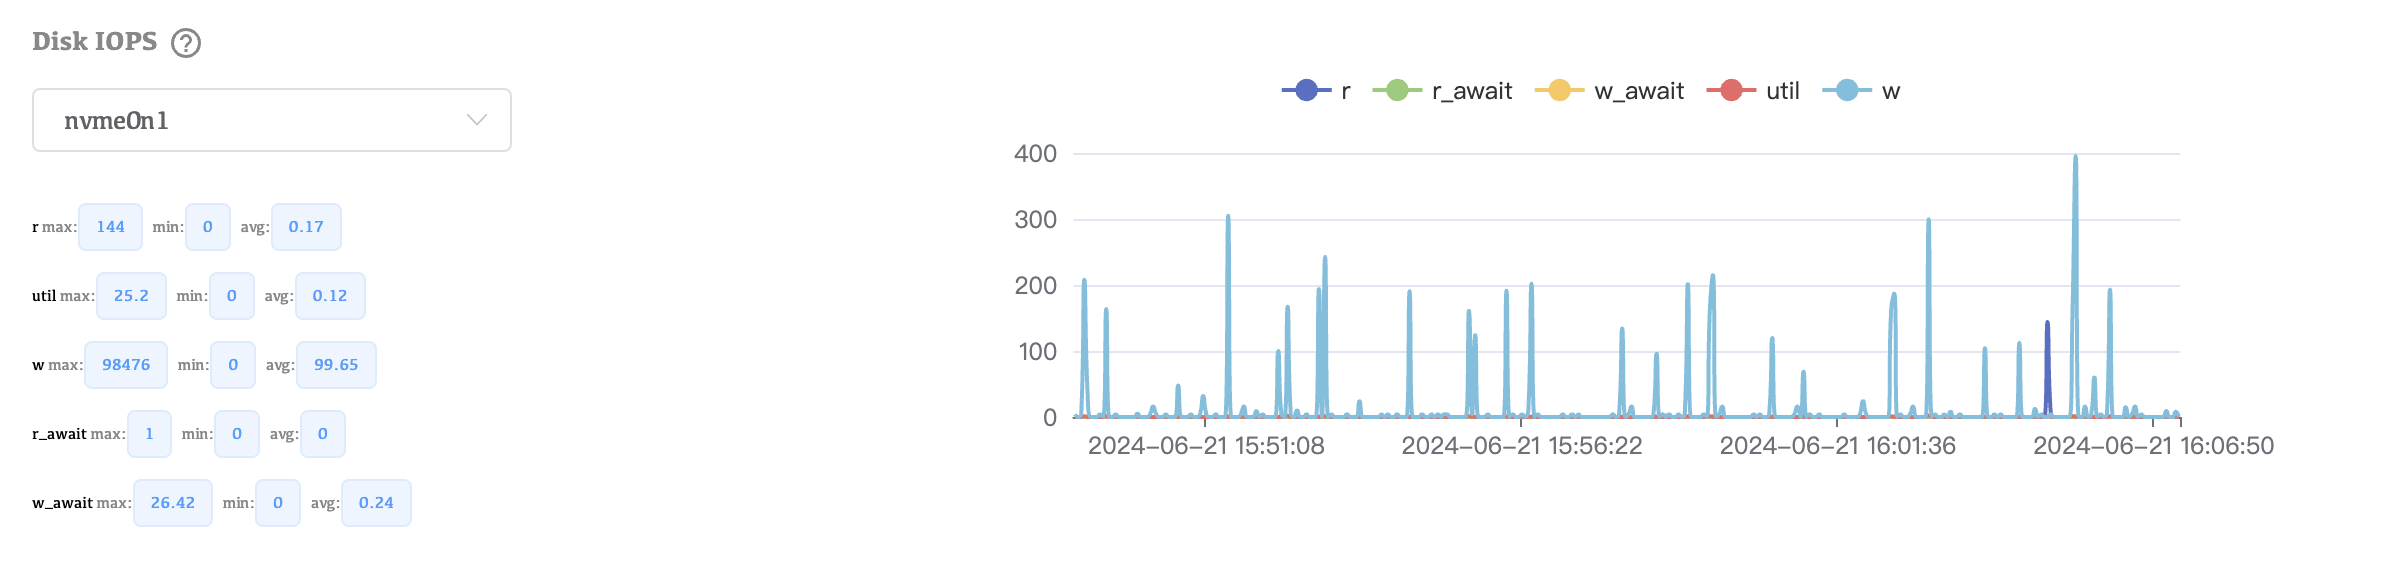
Disk IOPS: Measures input/output operations per second on the disk, indicating how quickly data is read from or written to the disk.
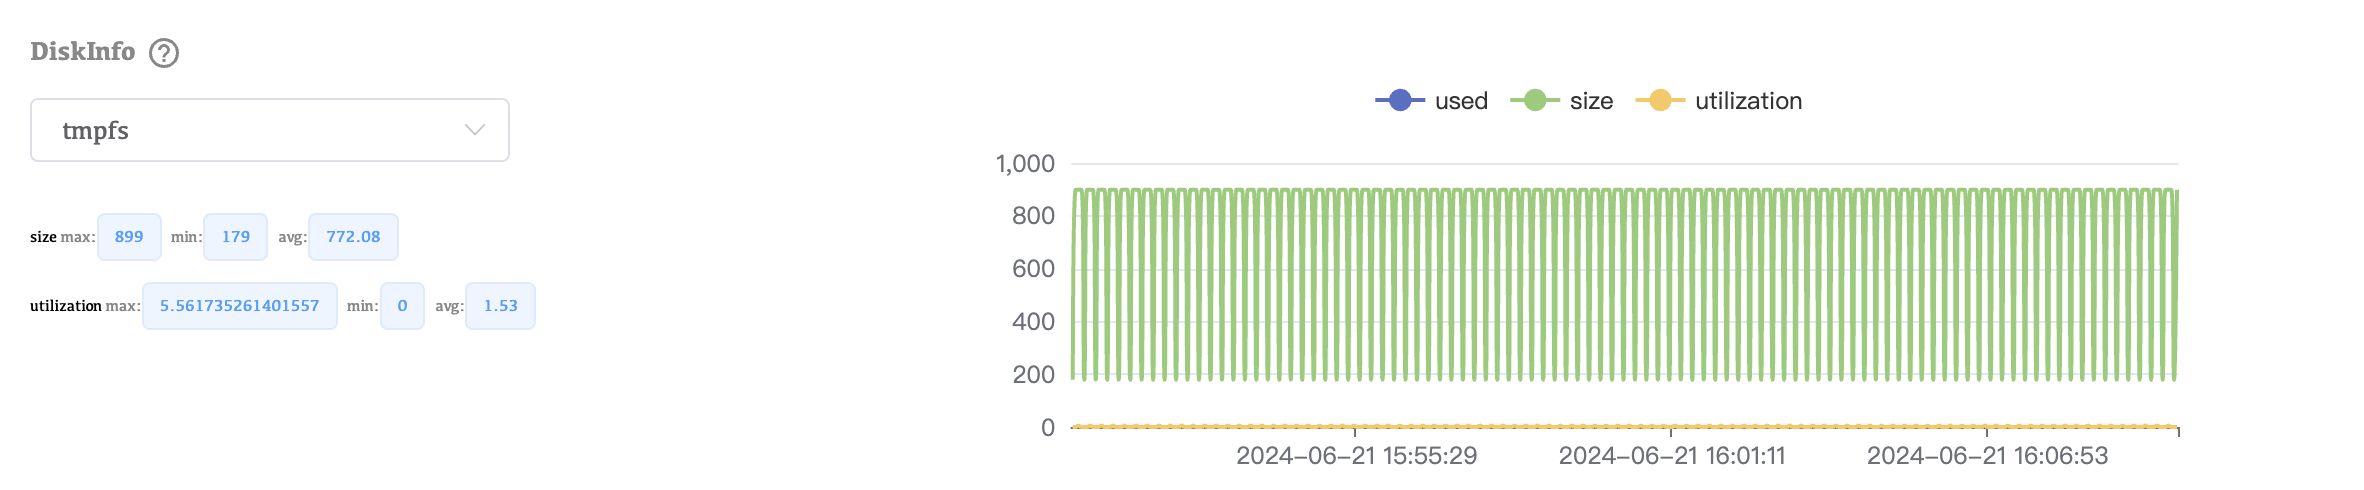
DiskInfo: Provides detailed information about disk usage and health.
MongoDB-specific Metrics
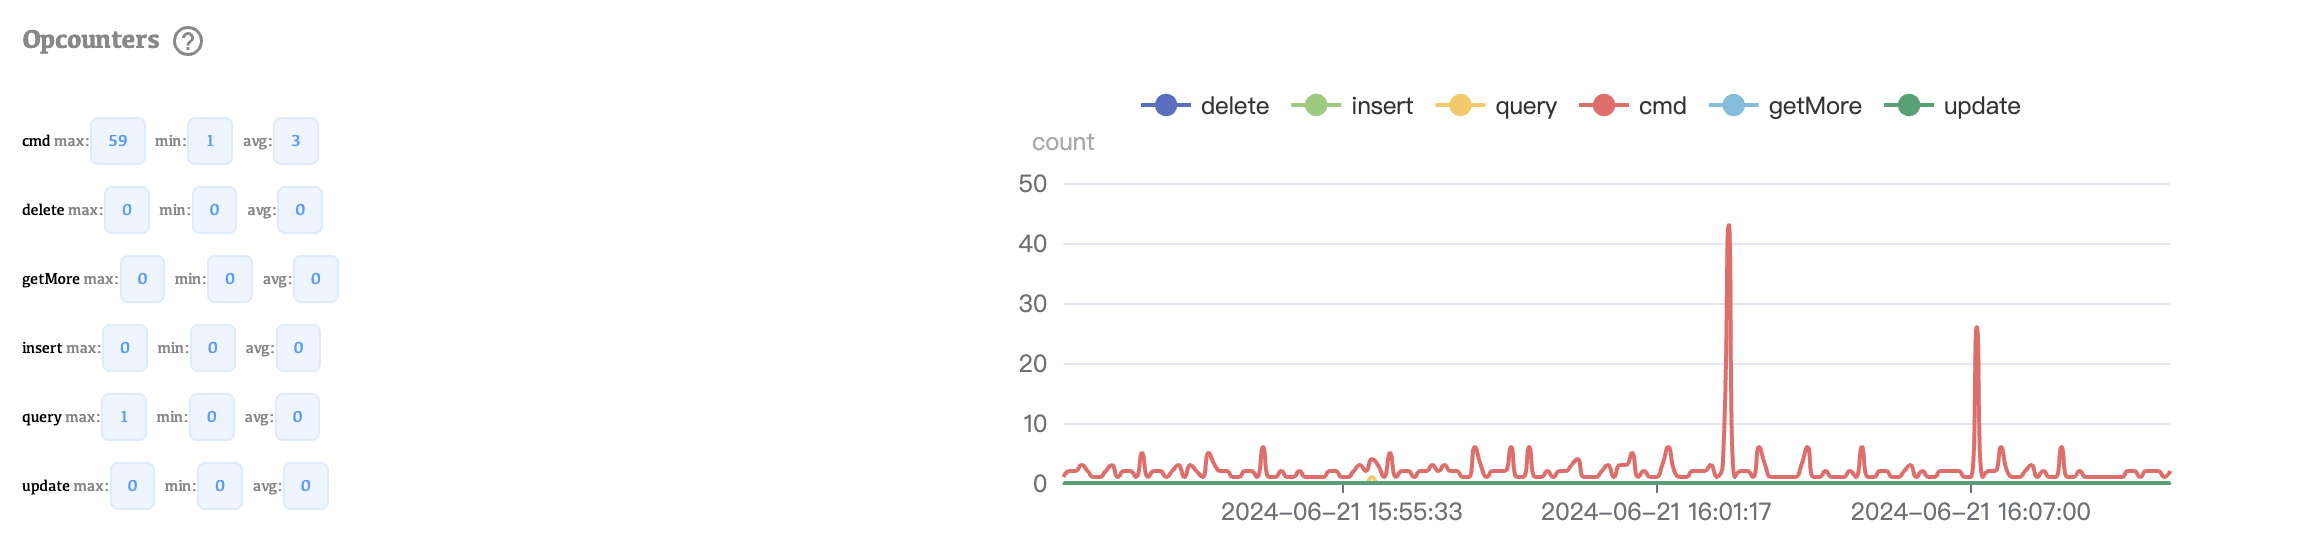
Opcounters: Tracks the number of operations (insert, query, update, delete, etc.) performed.
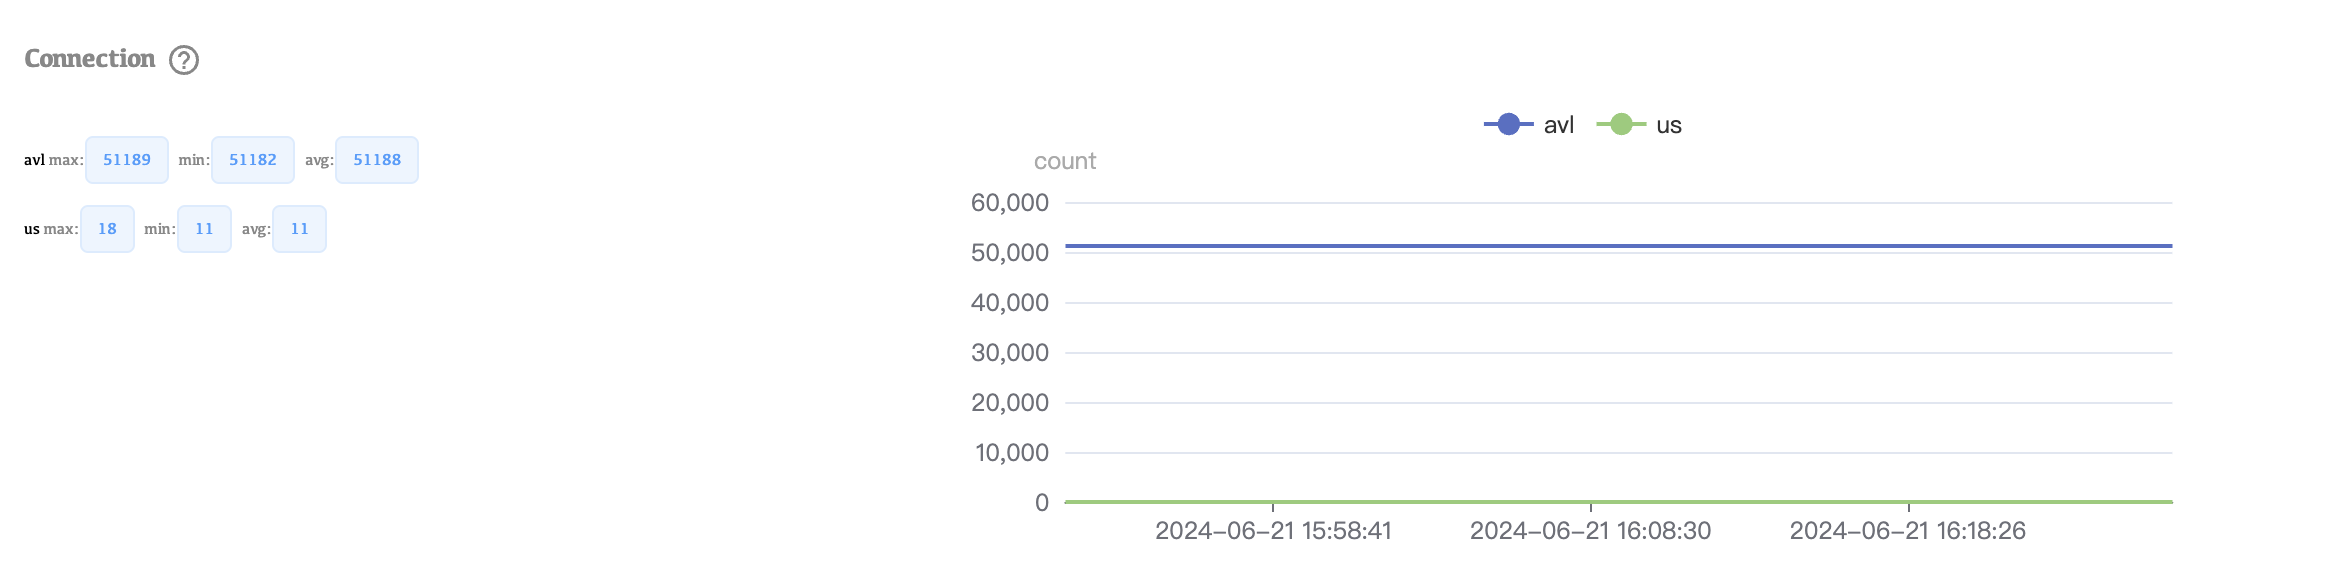
Connections: Monitors the number of active client connections to ensure the system can handle the load.
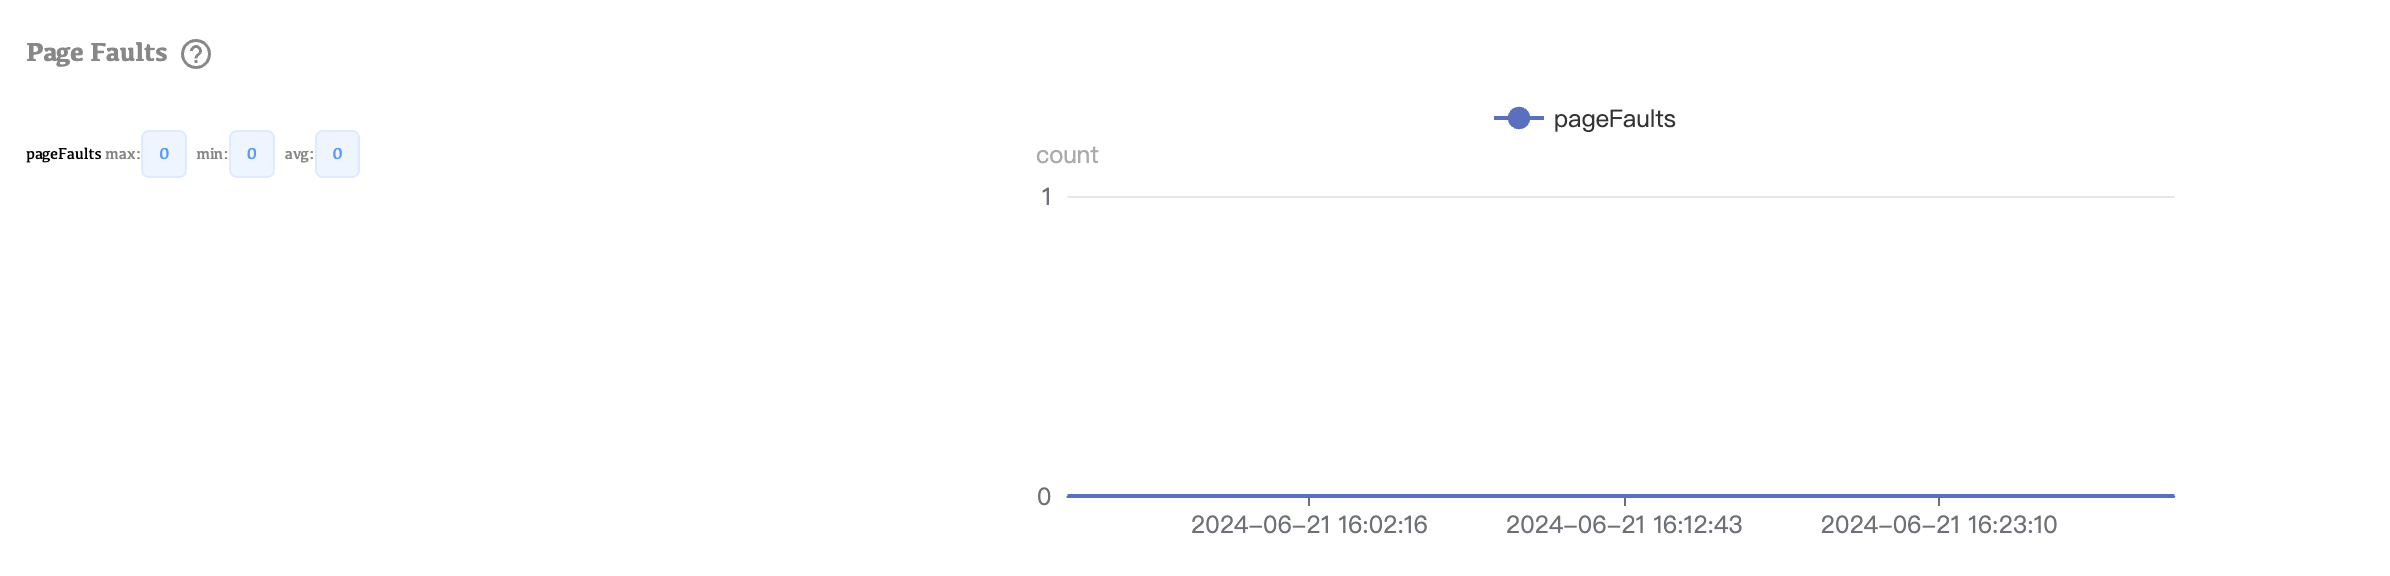
Page Faults: Measures the rate of page faults, indicating how often MongoDB needs to read data from disk into memory.
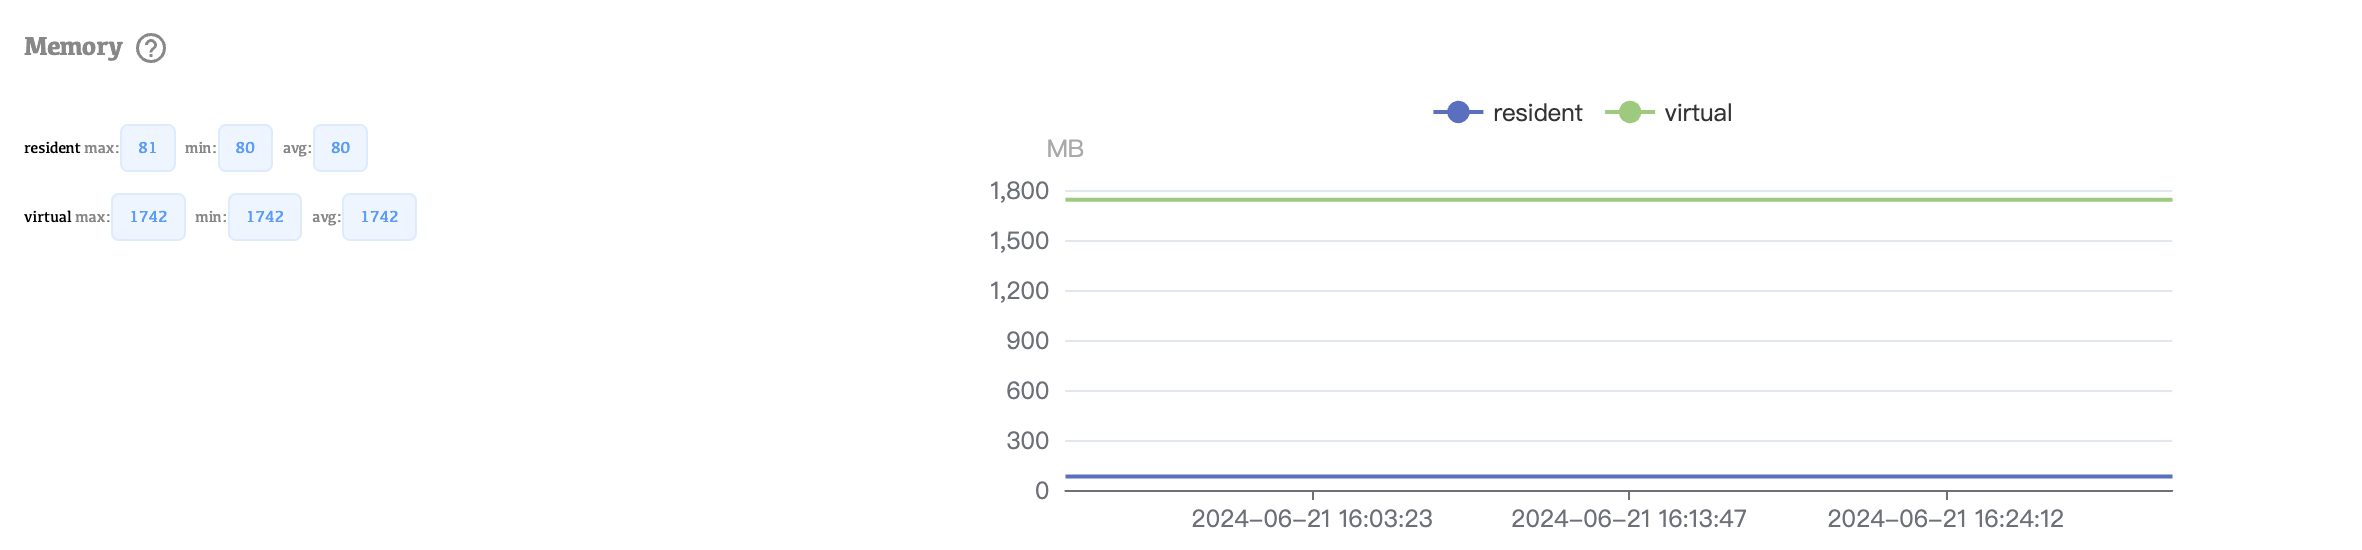
Memory: Tracks MongoDB’s internal memory usage, including how much memory is used by different components.
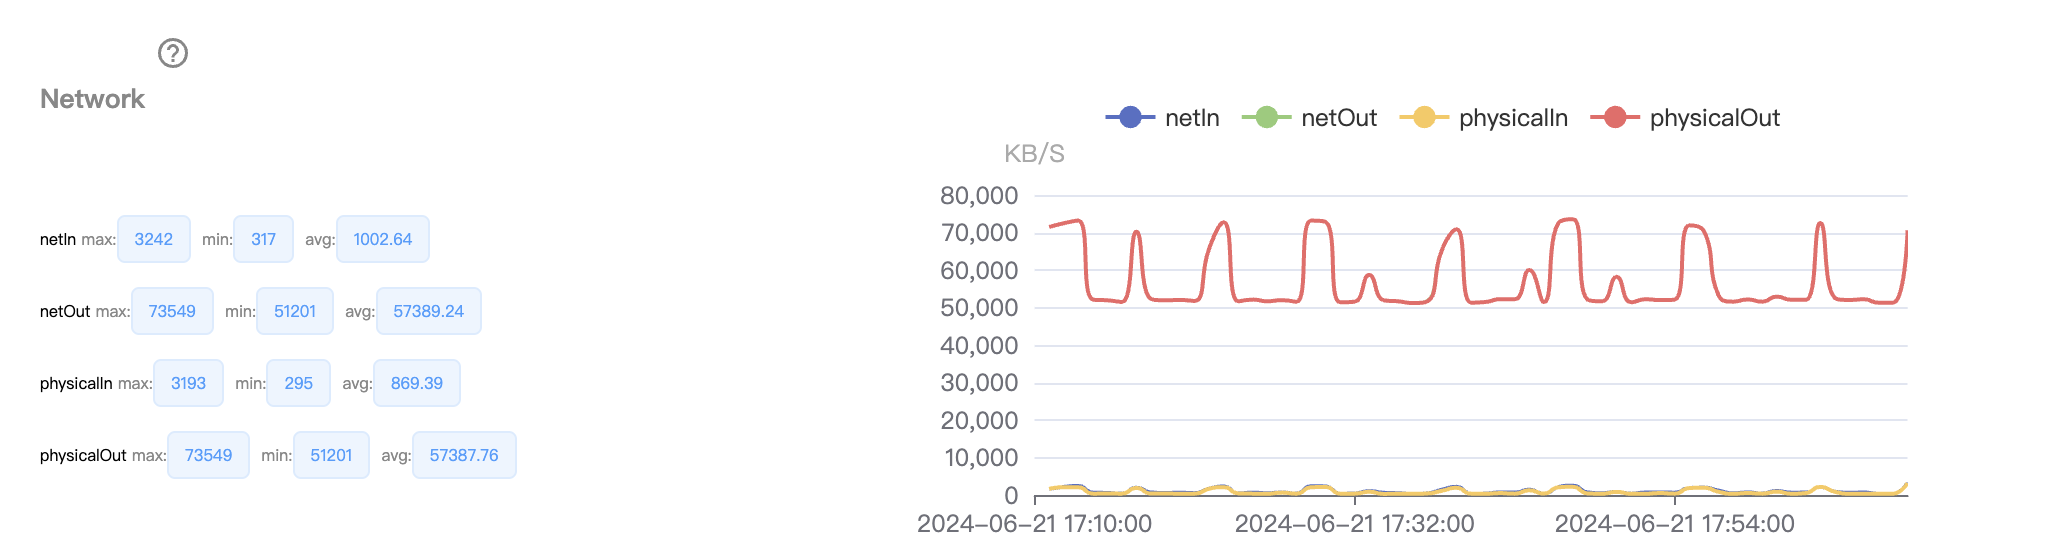
Network: Monitors MongoDB network traffic to ensure data is being transmitted efficiently.
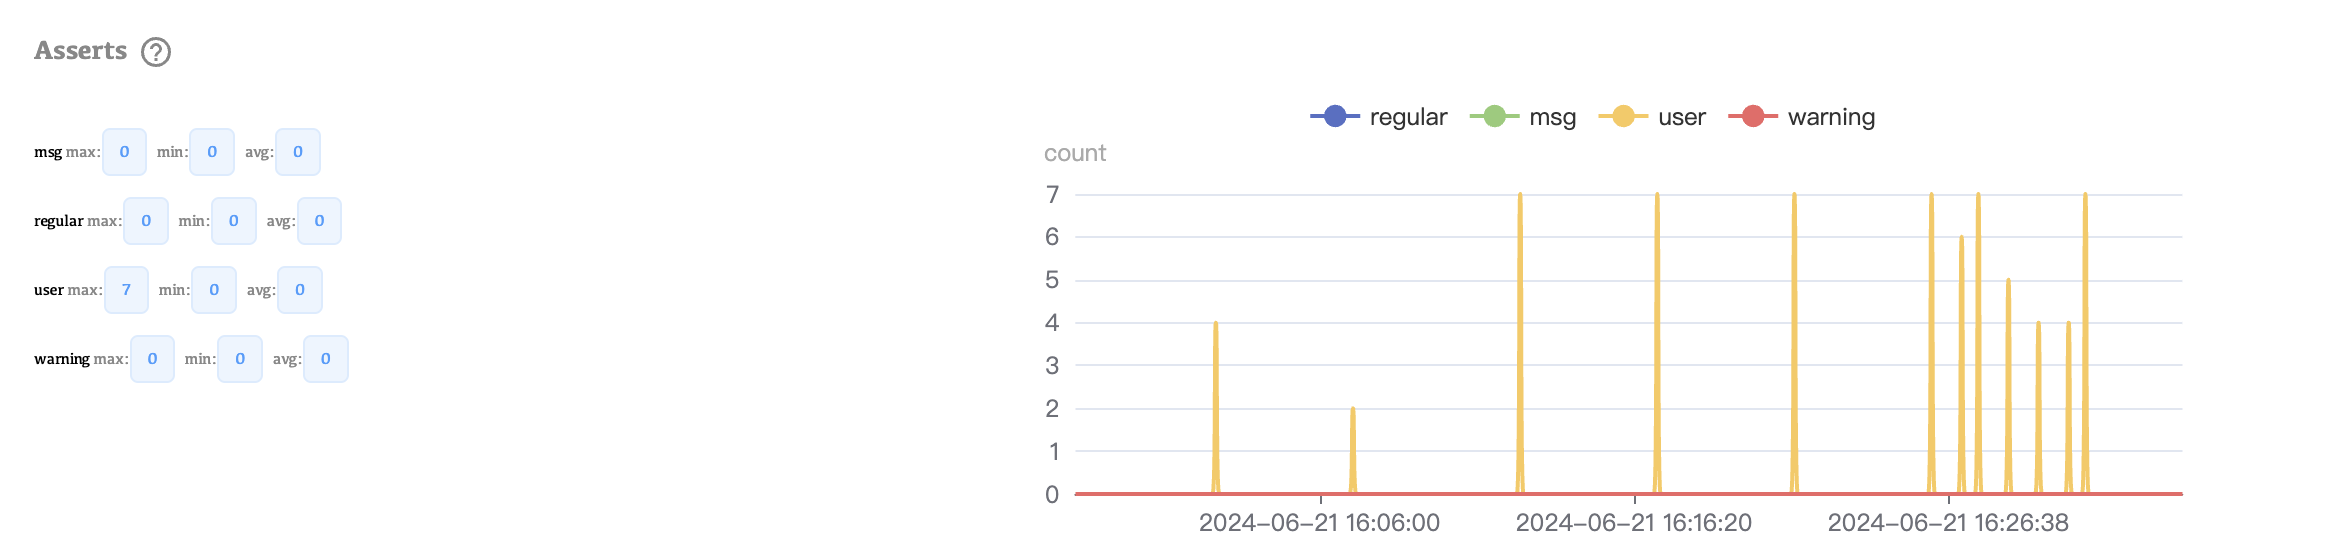
Asserts: Tracks internal database assertions, which can indicate potential issues or bugs.
Cache Metrics
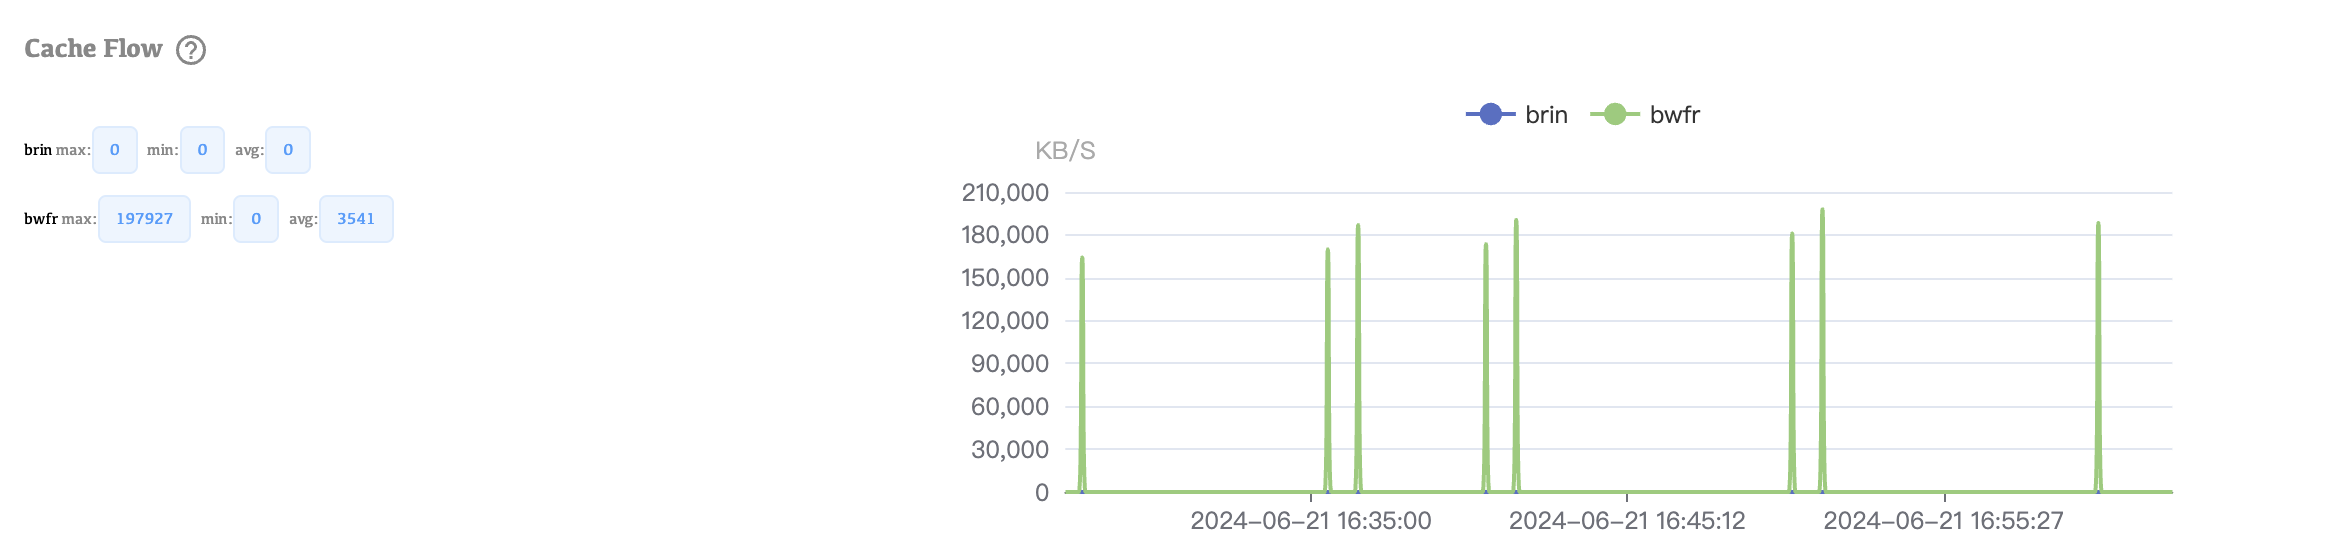
Cache Flow: Measures the flow of data into and out of the cache, indicating cache efficiency.
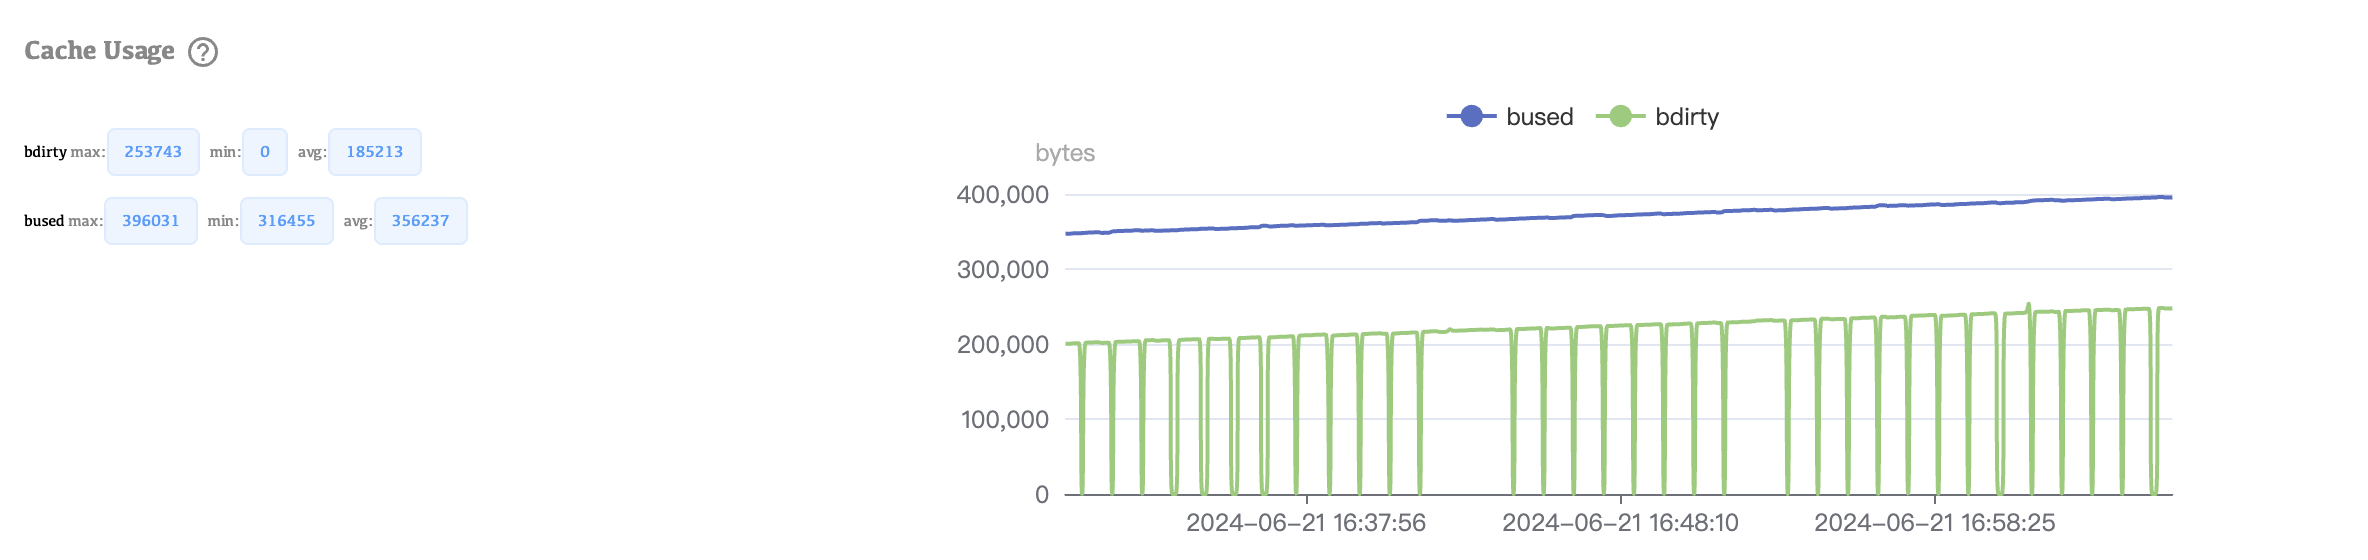
Cache Usage: Monitors how effectively the cache is being utilized.
Performance Metrics
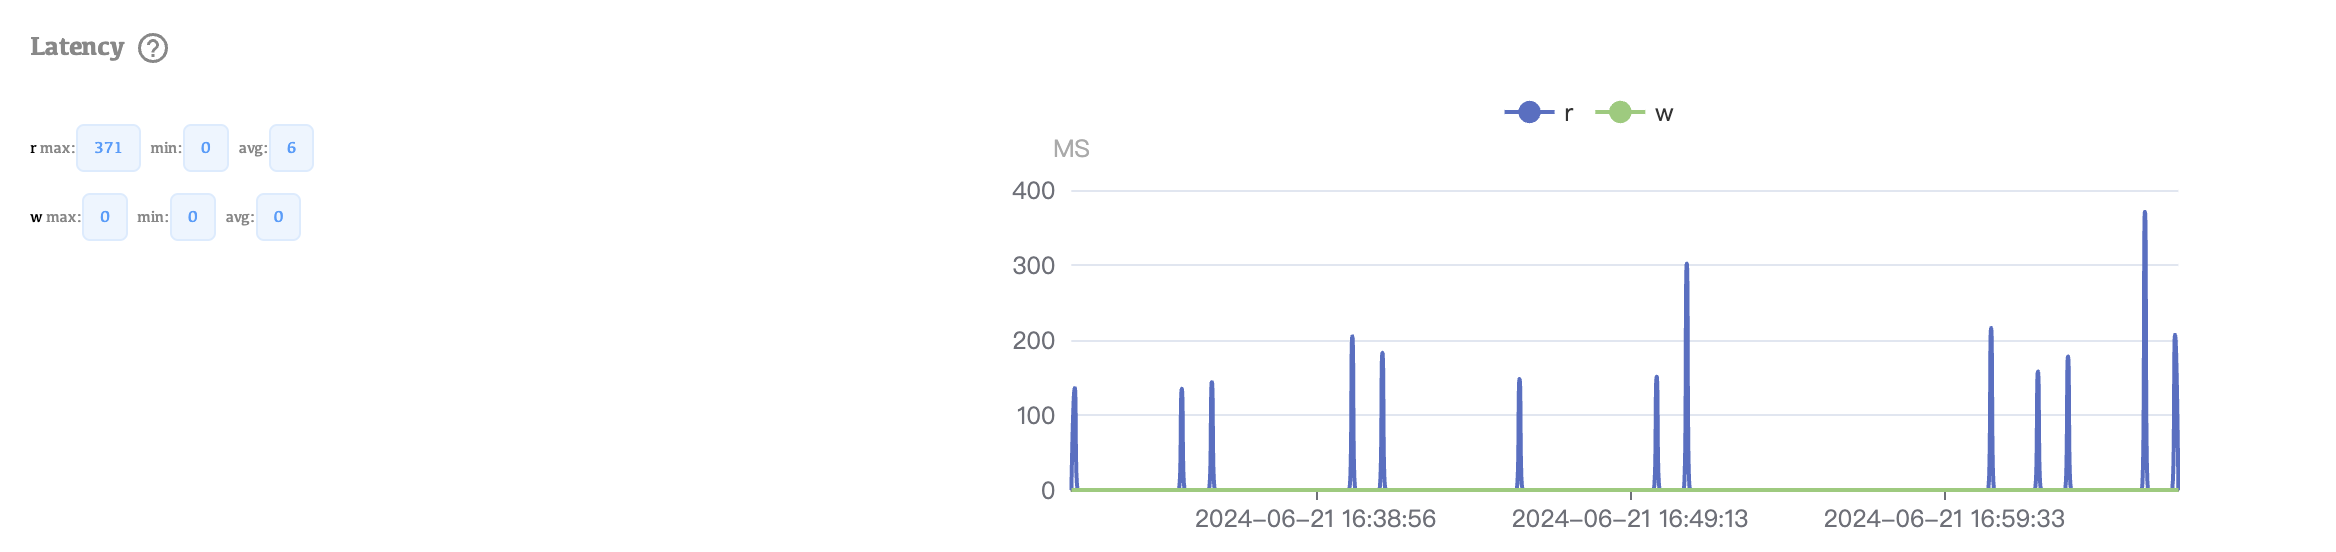
Latency: Measures the response time for queries, helping to identify performance bottlenecks.
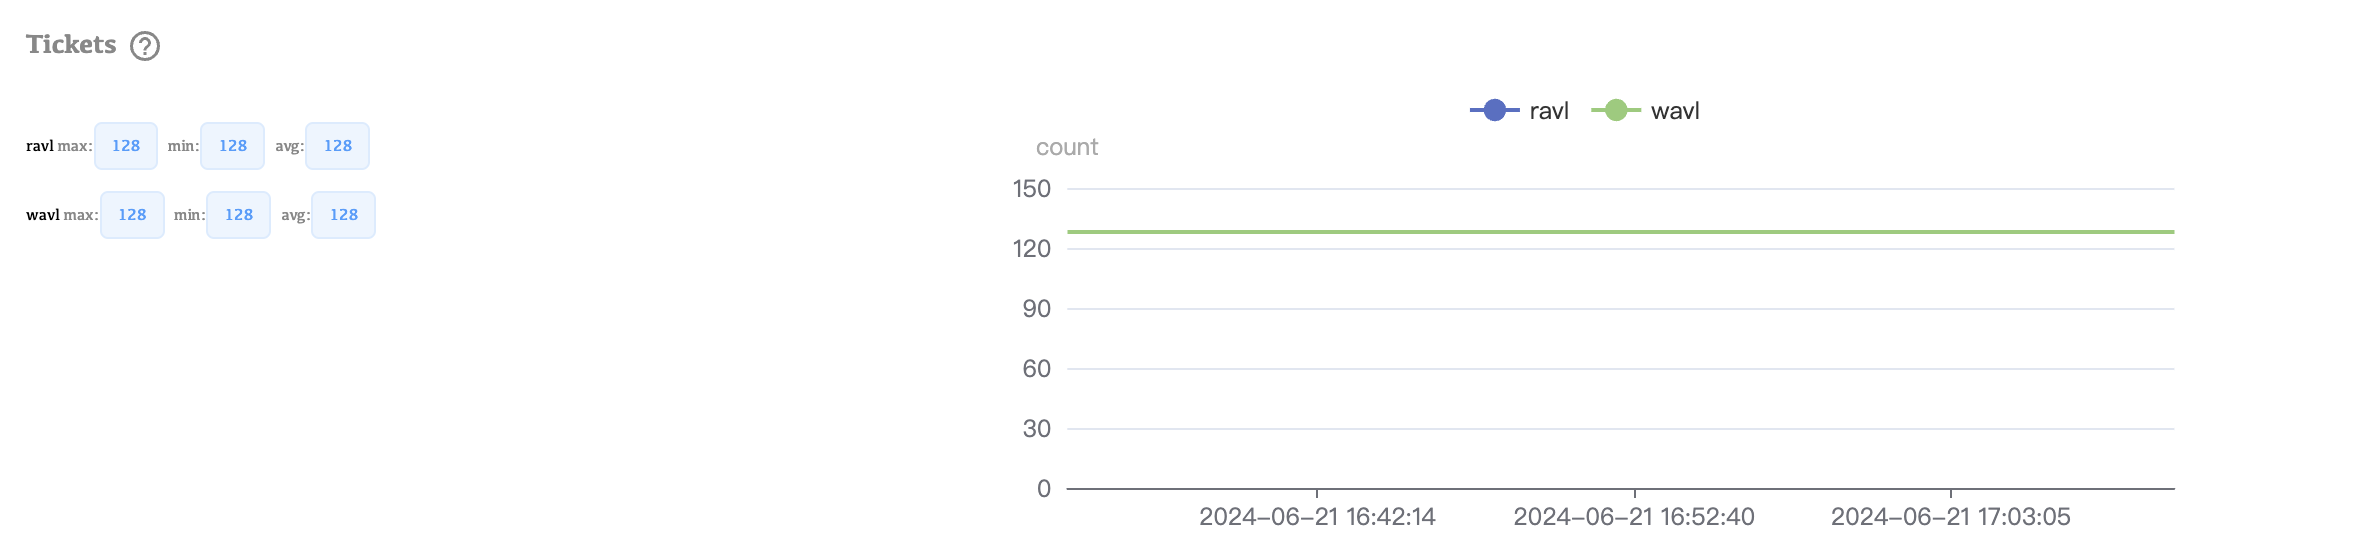
Tickets: Tracks the availability of tickets for read and write operations, indicating resource contention.
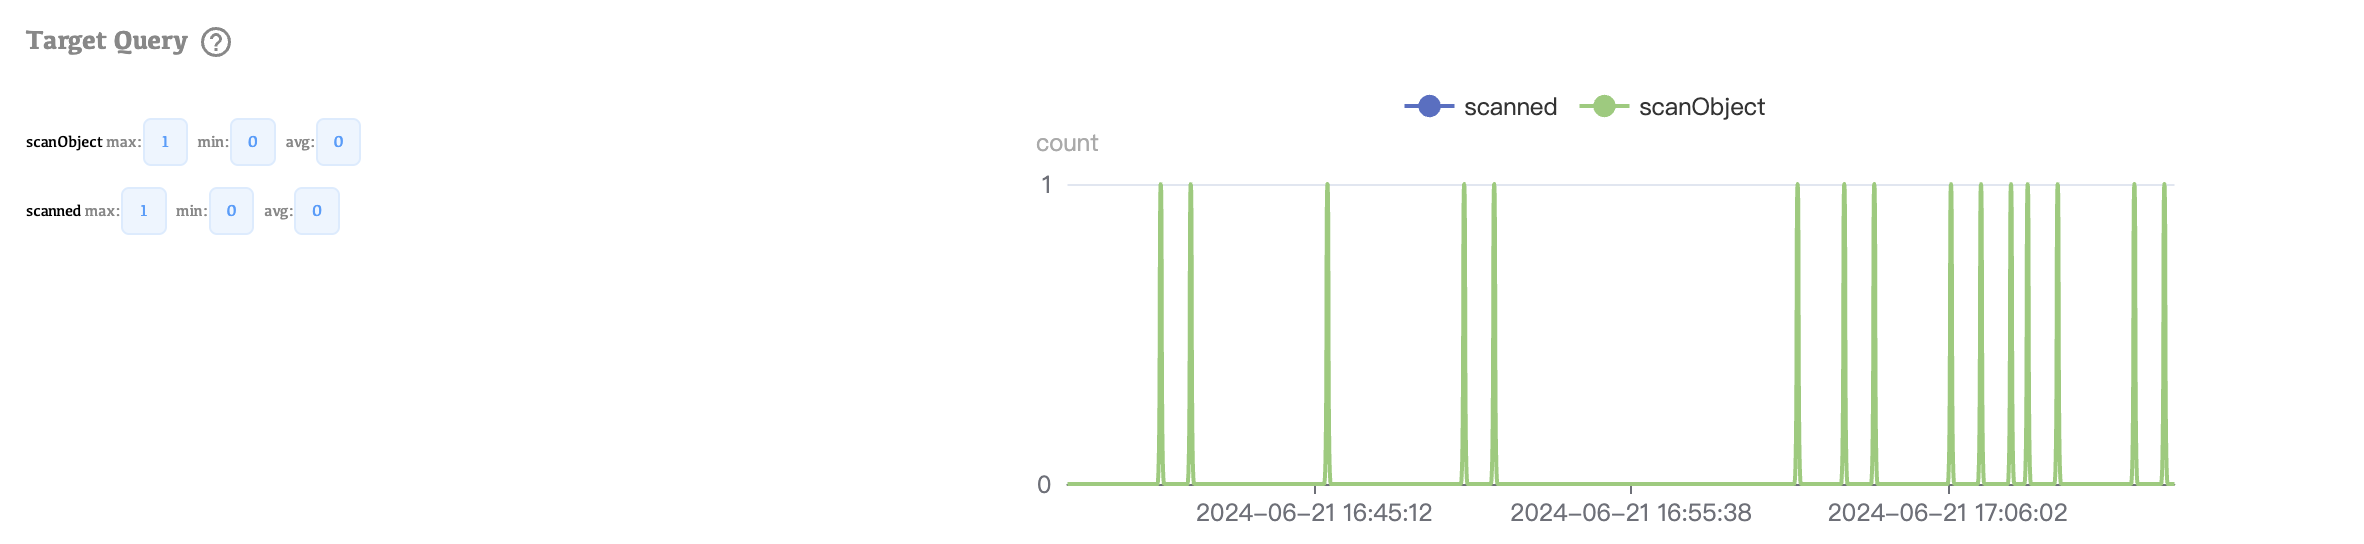
Target Query: Monitors the performance of specific targeted queries.
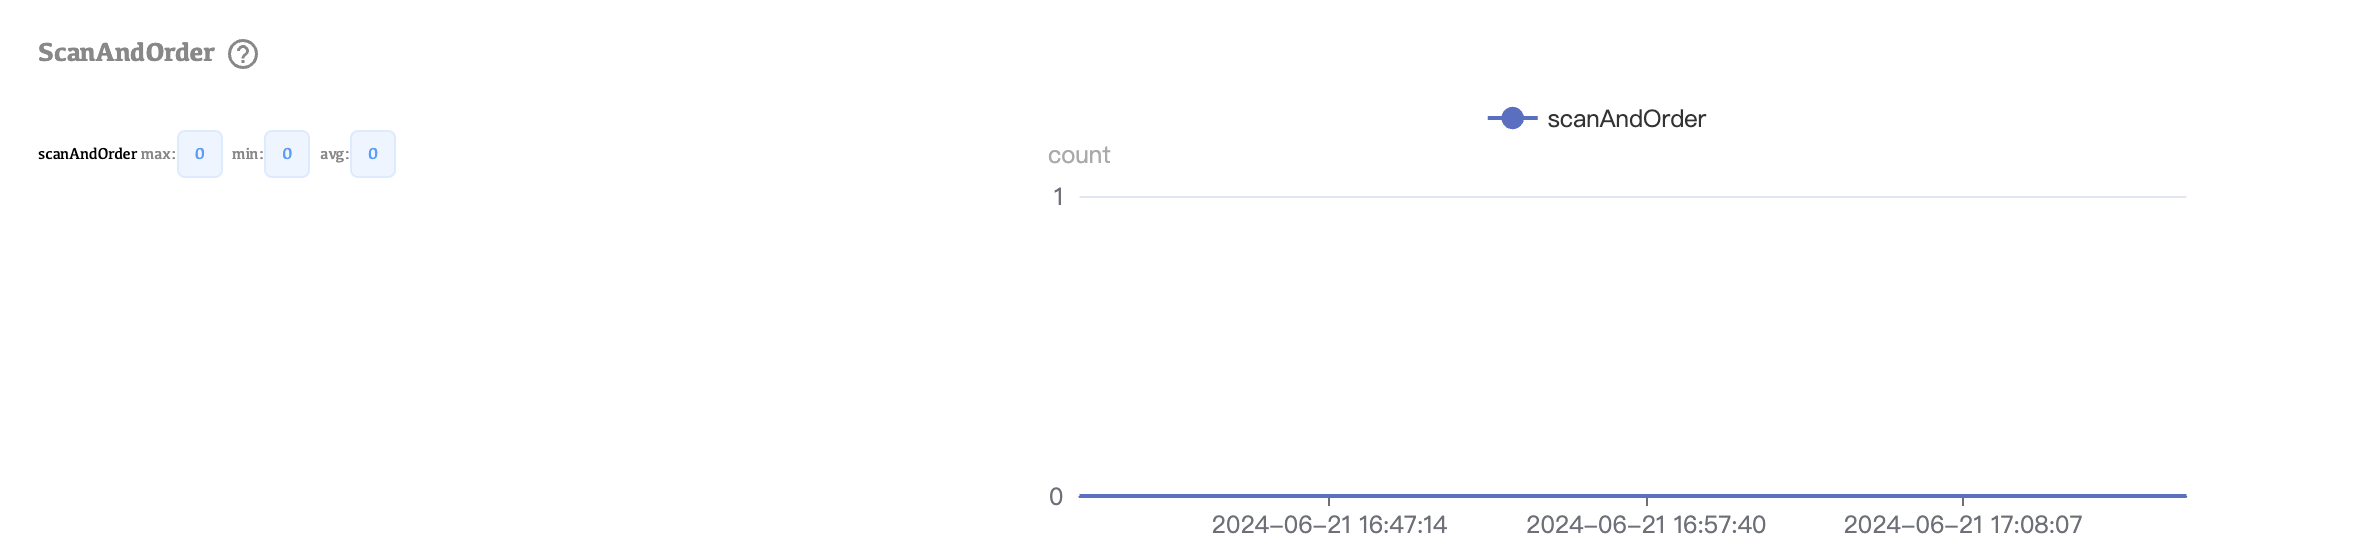
ScanAndOrder: Tracks operations where MongoDB must scan documents and order them in memory, which can be resource-intensive.
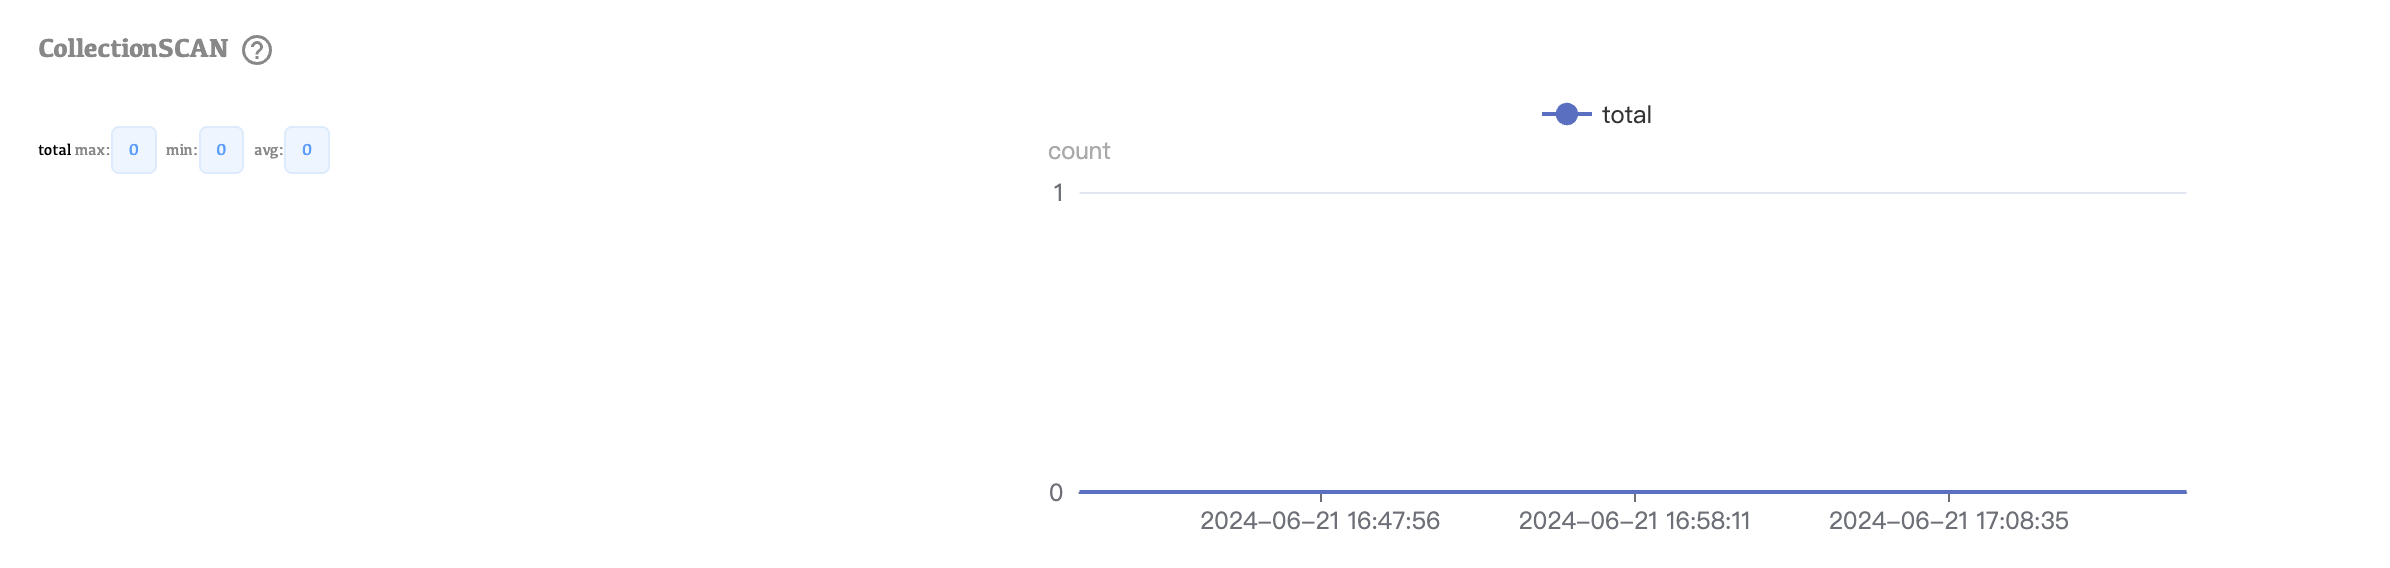
CollectionSCAN: Measures the frequency of collection scans, which are less efficient than indexed queries.
Document and Data Metrics
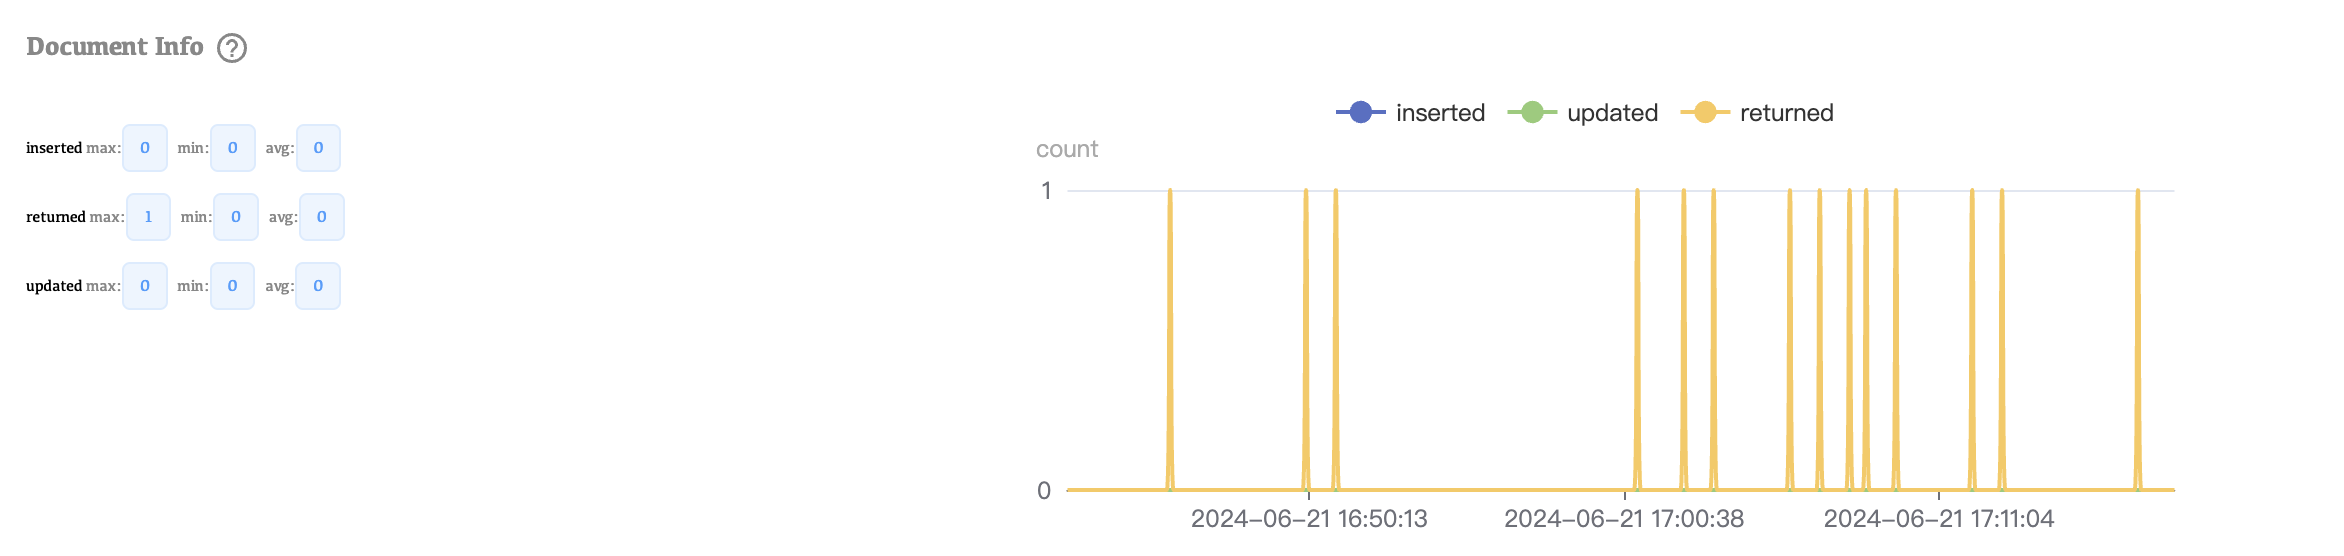
Document Info: Provides details about the number and size of documents.
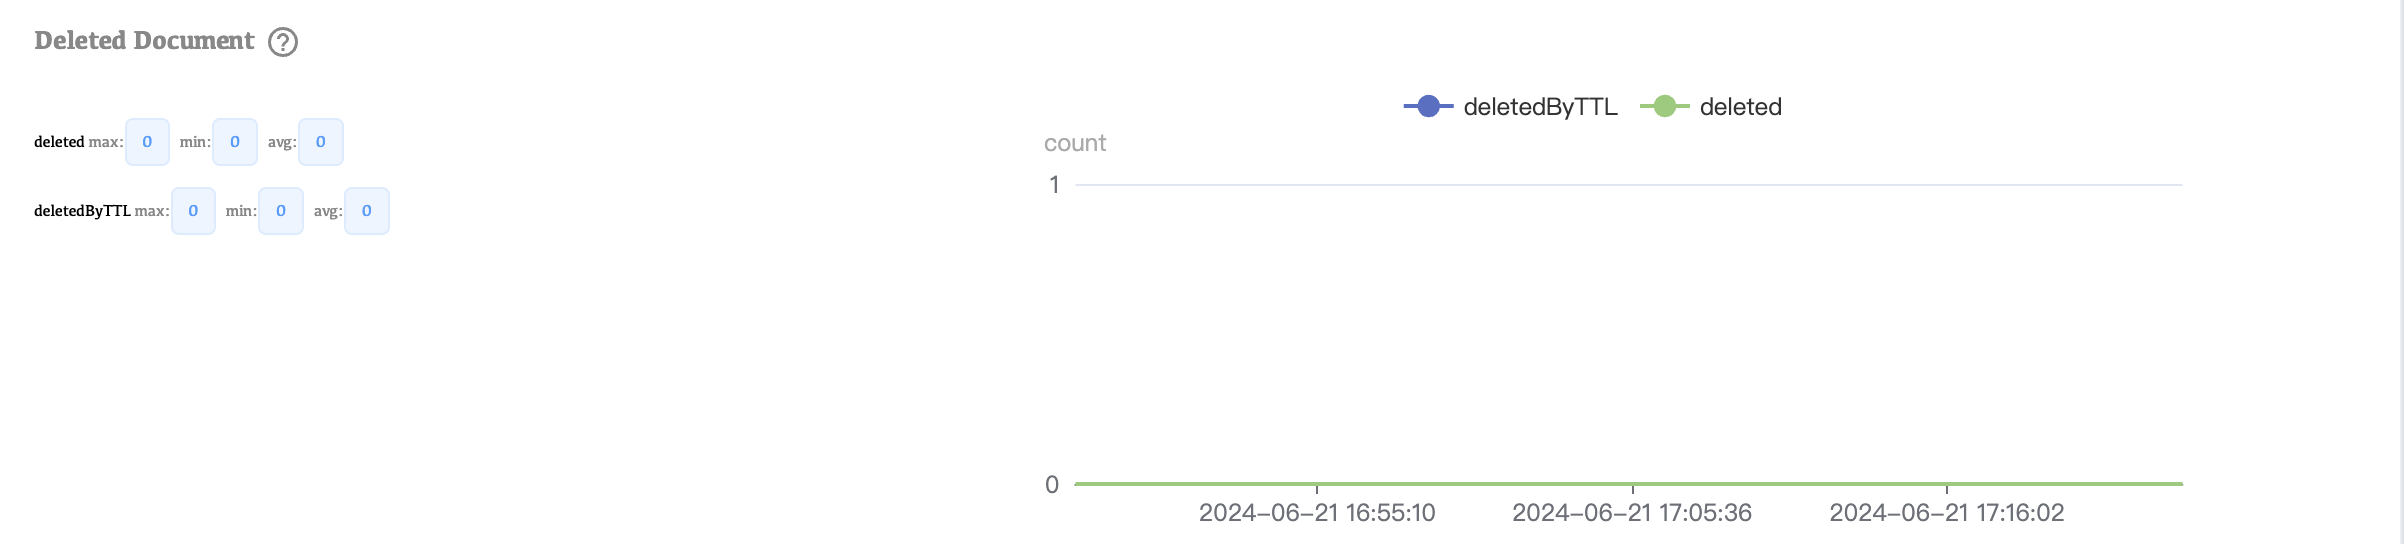
Deleted Document: Tracks the rate at which documents are deleted.
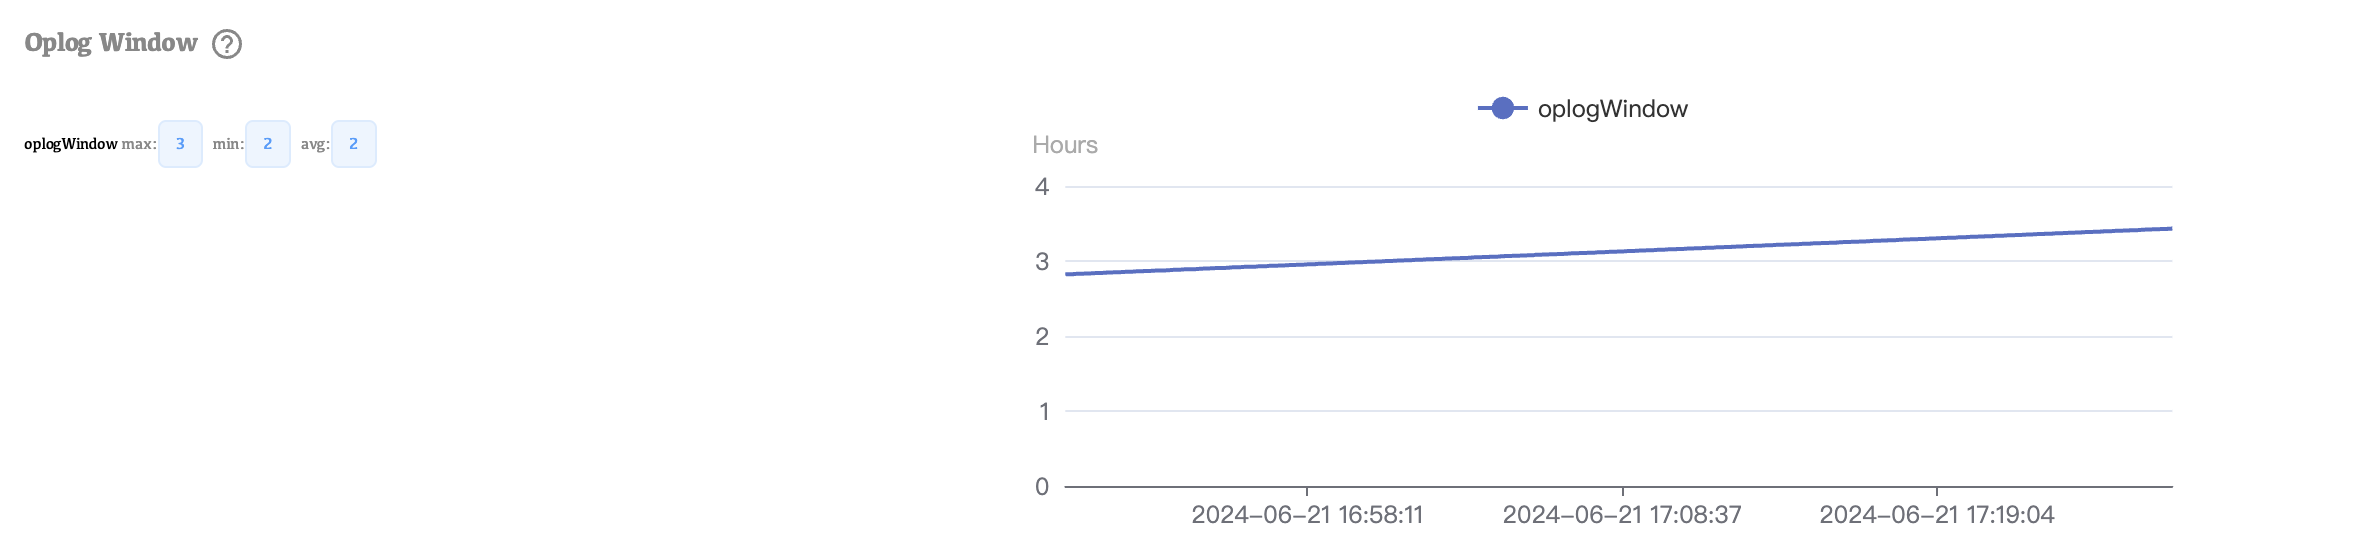
Oplog Window: Monitors the size of the oplog window, crucial for replication lag and recovery.
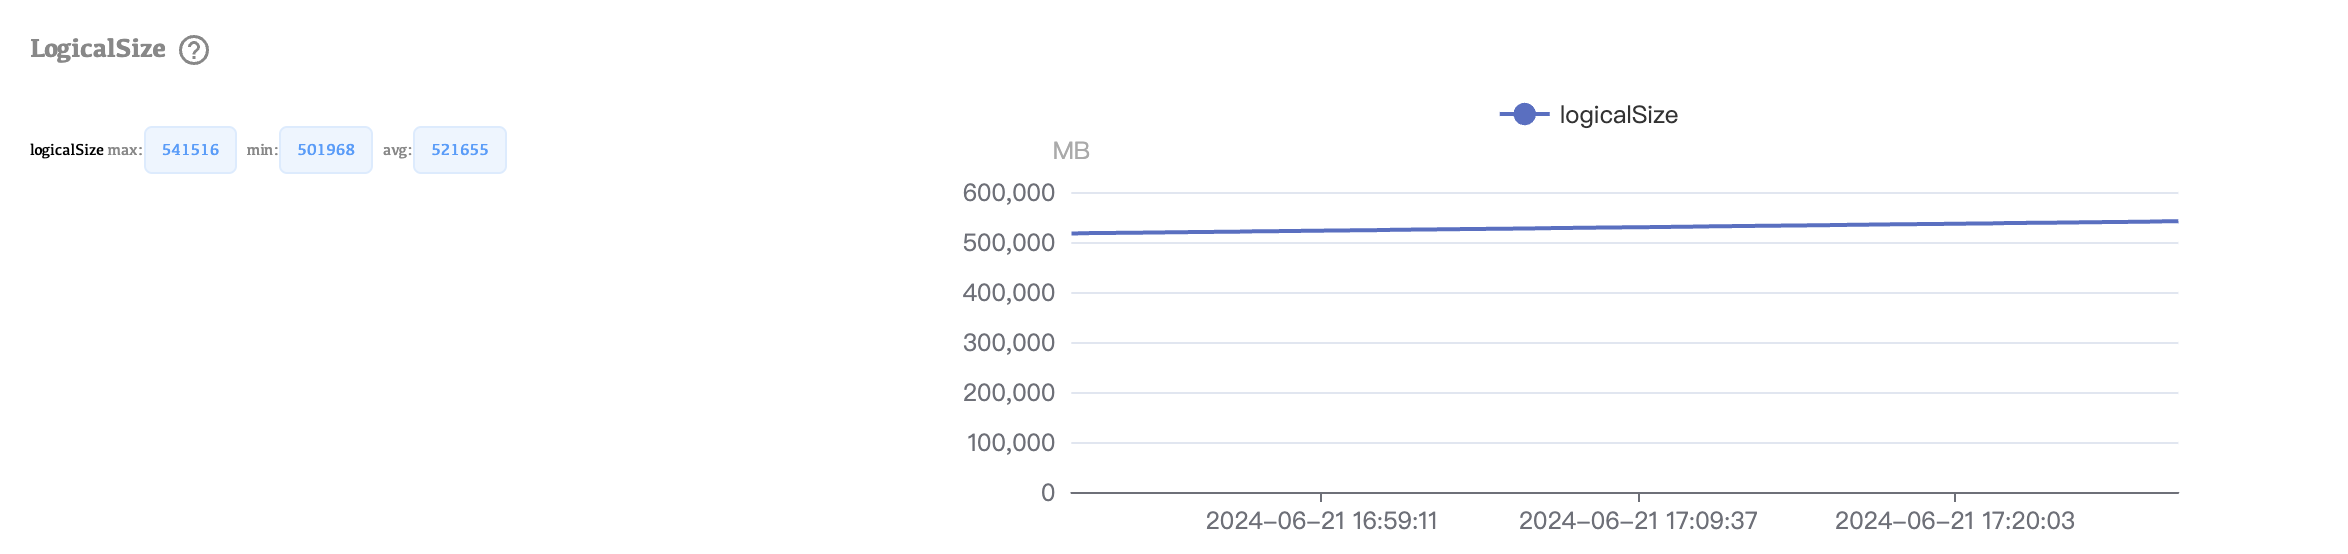
LogicalSize: Measures the logical size of the database, providing insight into data growth.
OpenCursor: Tracks the number of open cursors, indicating active database operations.
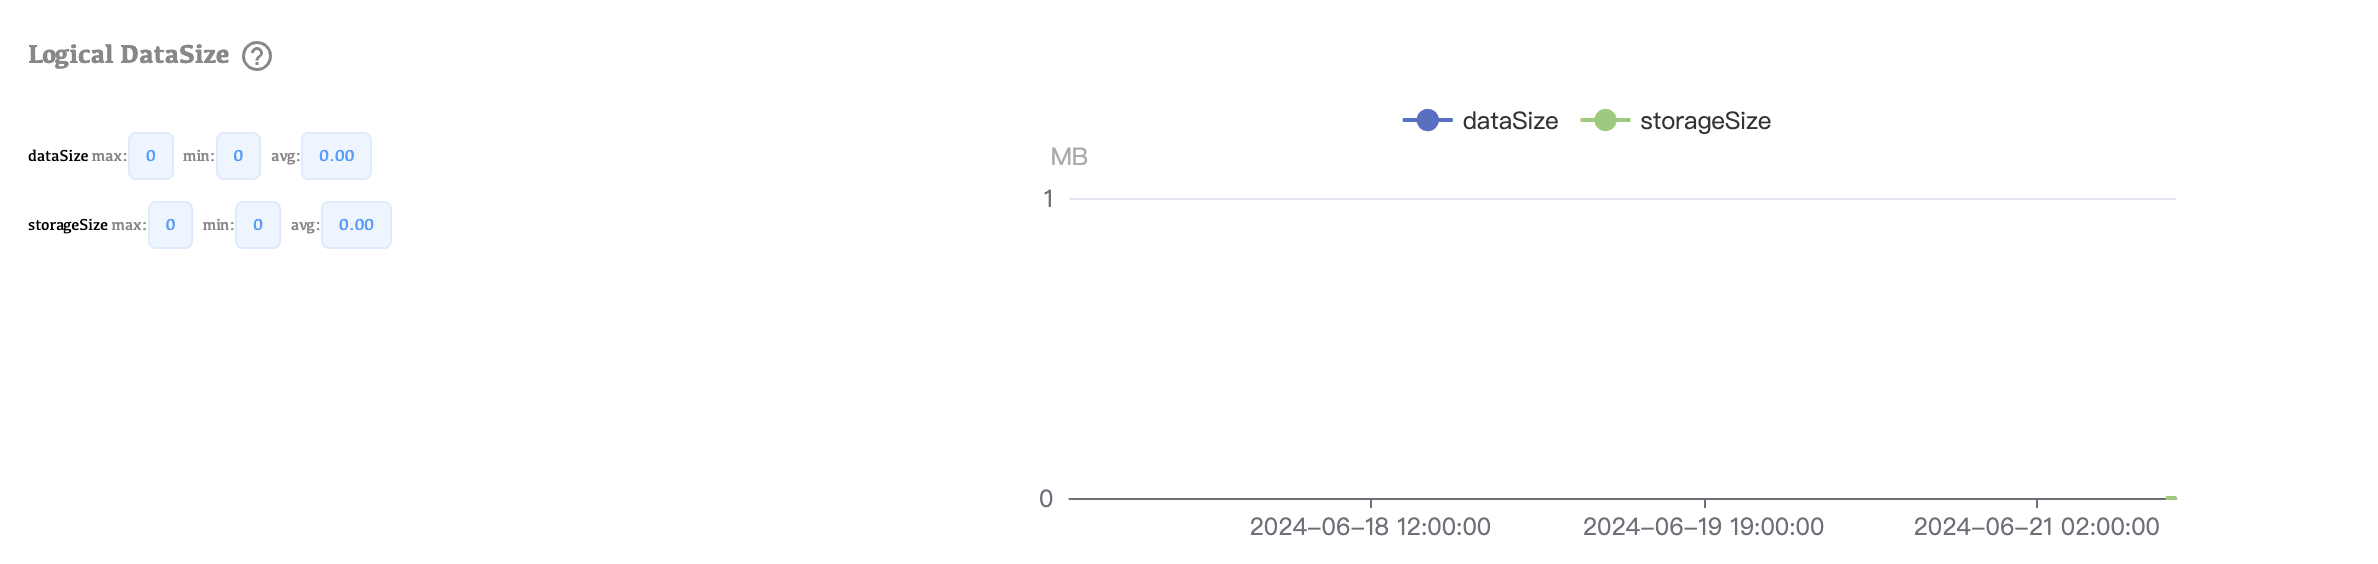
Logical DataSize: Measures the logical size of data stored in MongoDB.
IndexSize: Tracks the size of indexes, impacting query performance.
OplogSize: Monitors the size of the oplog, essential for replication health.
Lock and Transaction Metrics
LockCondition: Tracks lock contention within MongoDB, which can affect performance.
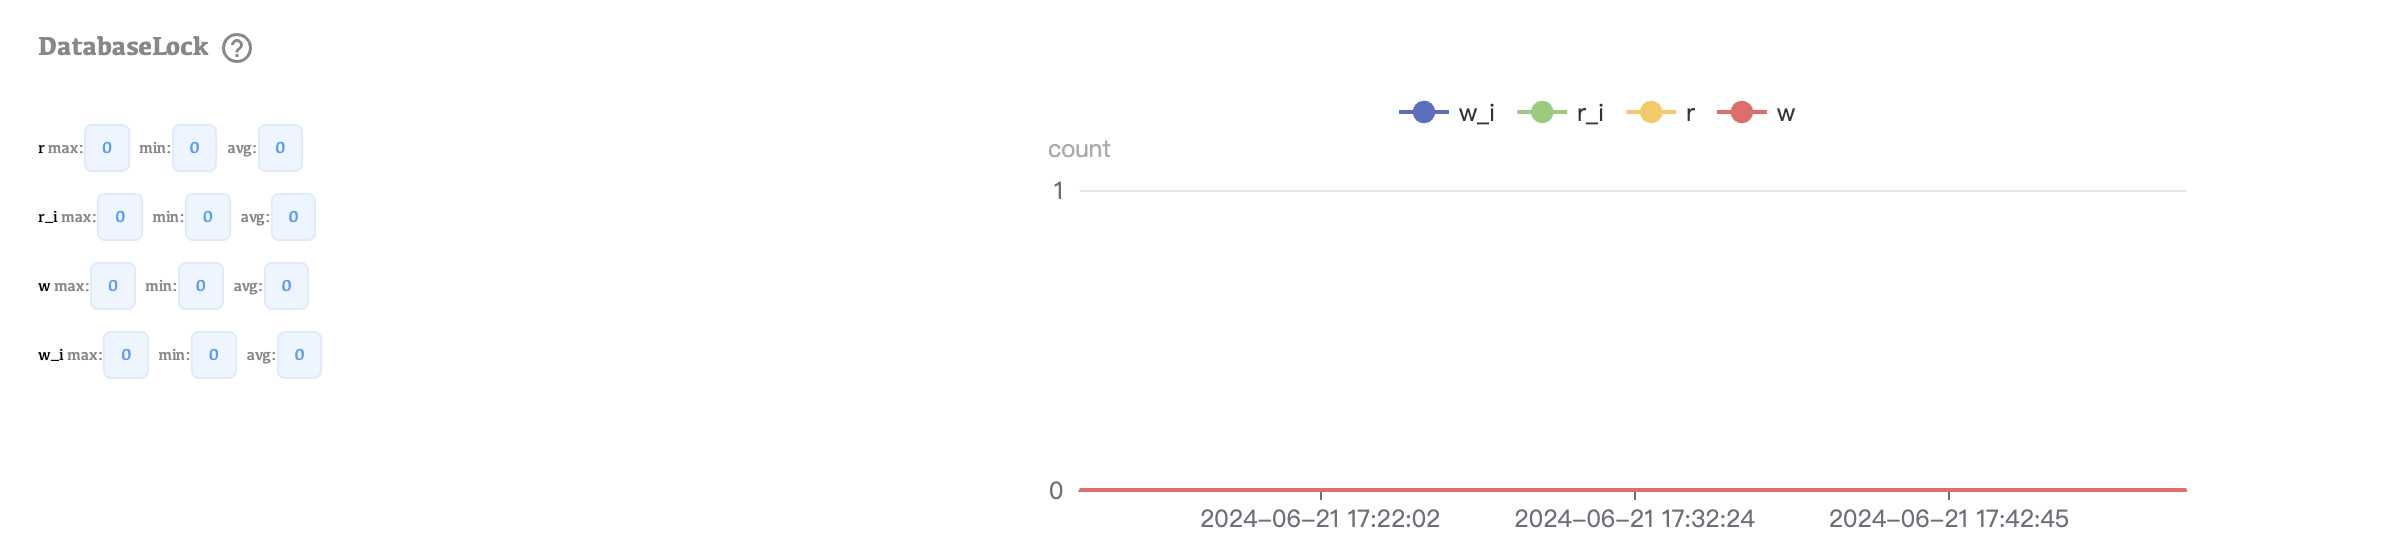
DatabaseLock: Measures the time the database is locked for various operations.
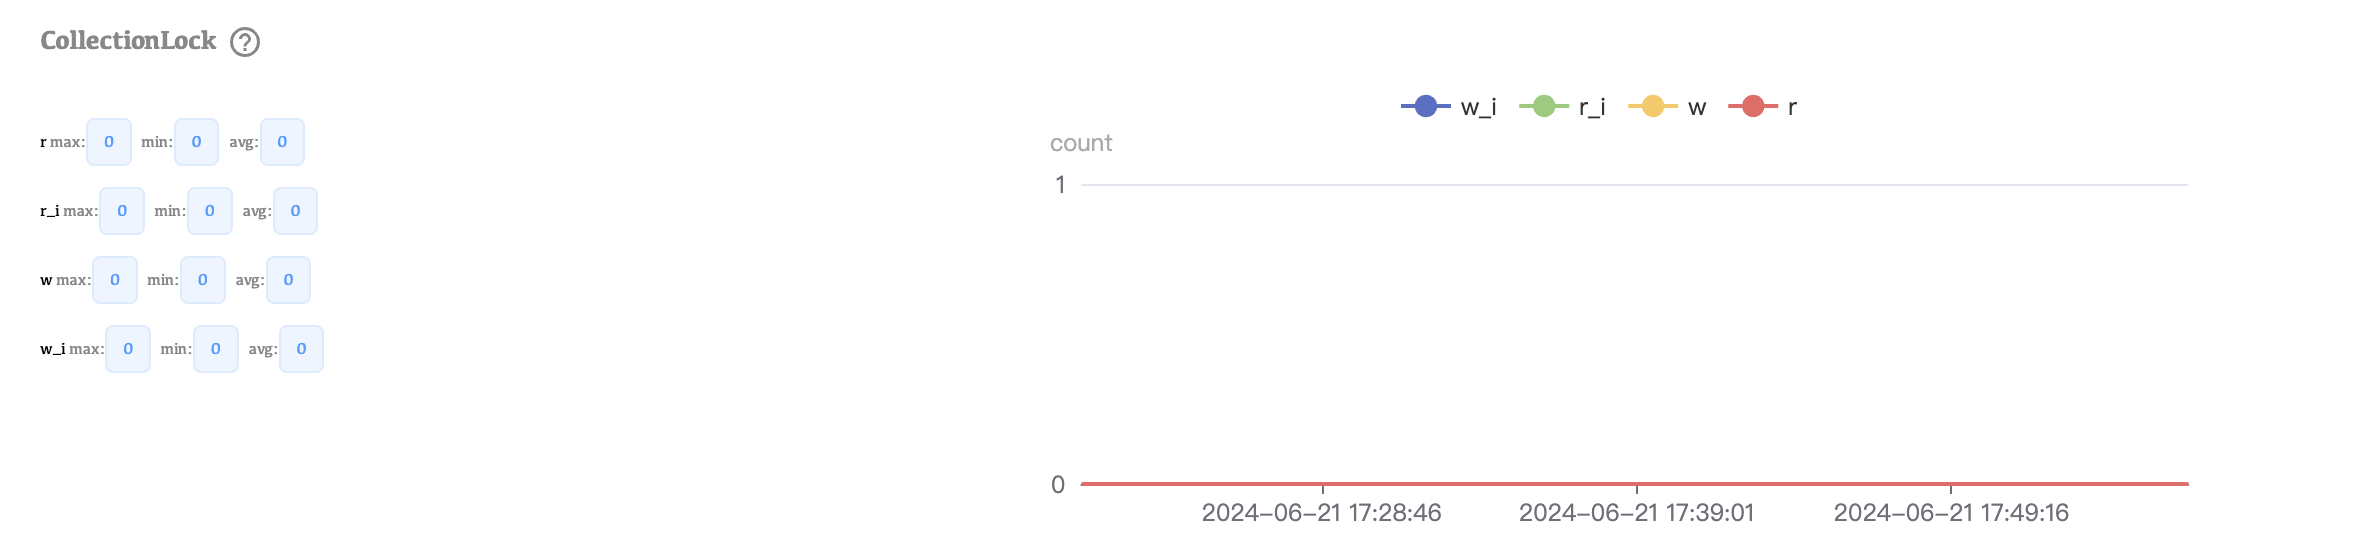
CollectionLock: Monitors lock contention at the collection level.
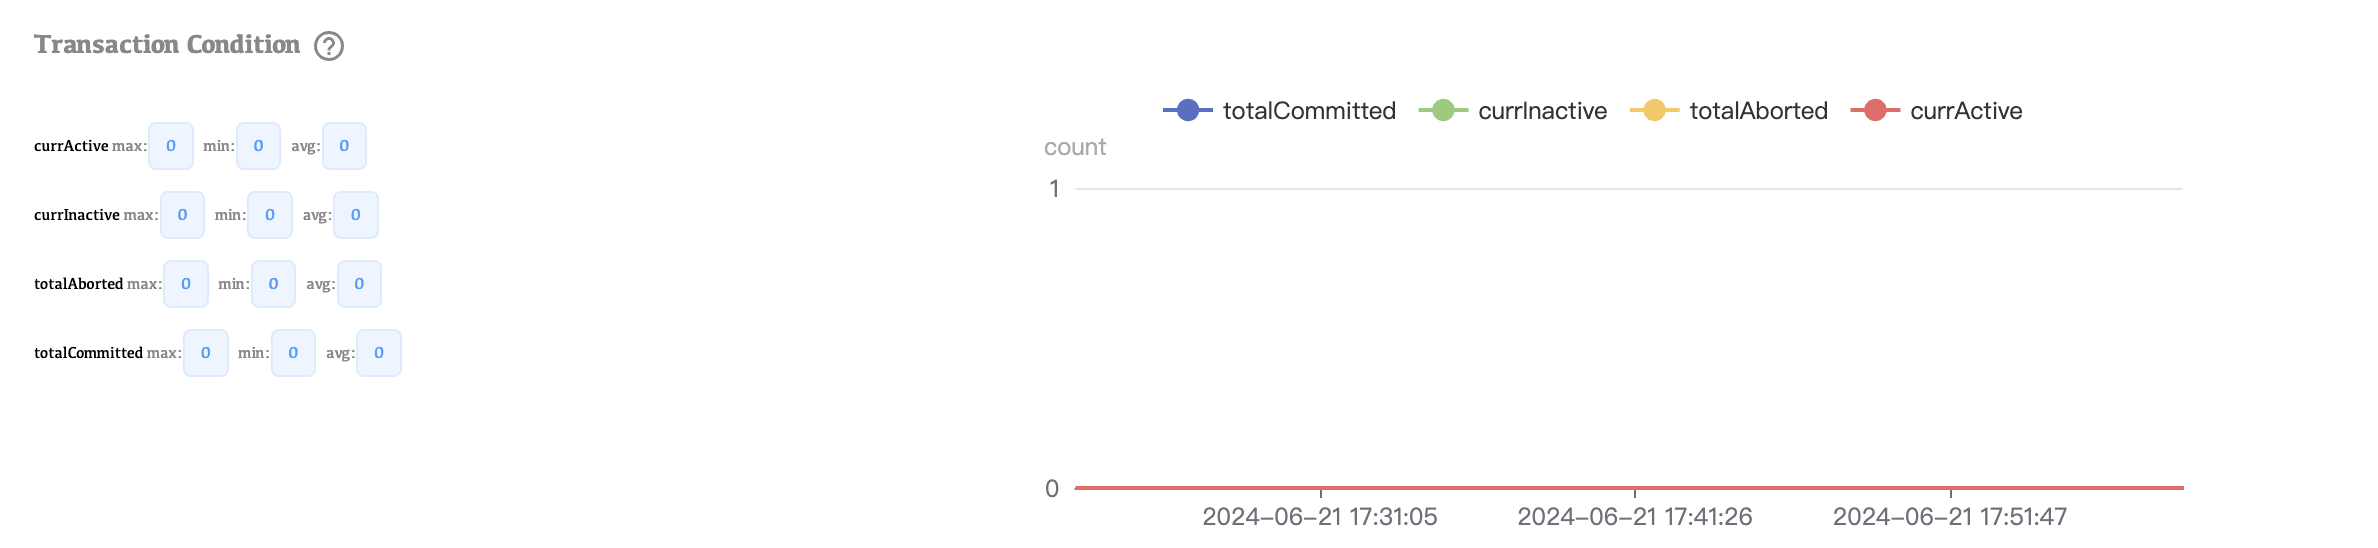
Transaction Condition: Tracks transaction performance and conflicts.